What Is A Venn Diagram? Mathematics for WASSCE and BECE candidates
What Is A Venn Diagram? Mathematics for WASSCE and BECE candidates
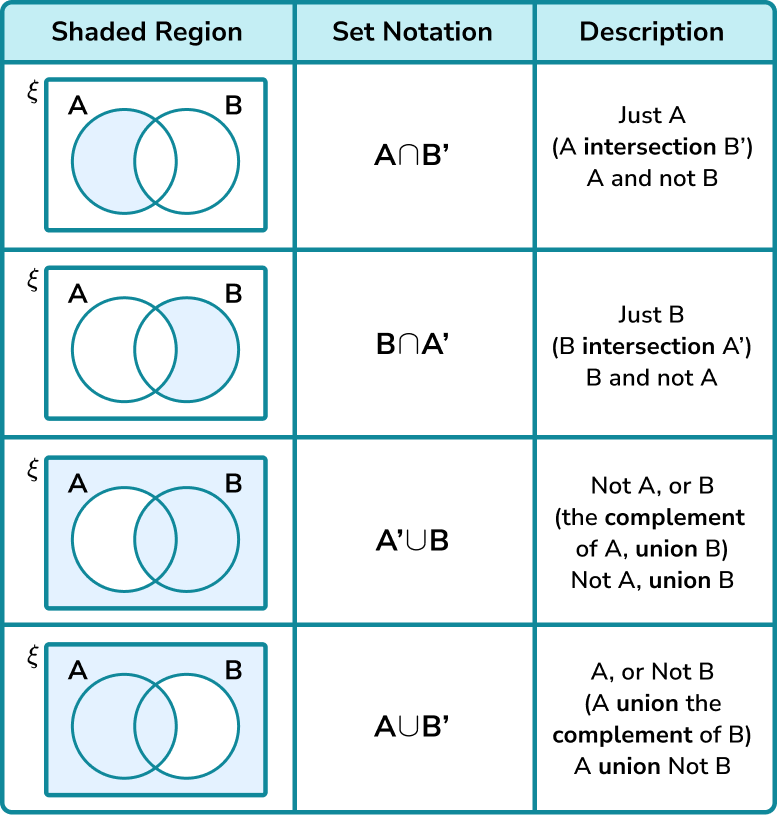
A Venn Diagram is a pictorial representation of the relationships between sets.
We can represent sets using Venn diagrams. In a Venn diagram, the sets are represented by shapes; usually circles or ovals. The elements of a set are labeled within the circle.
The following diagrams show the set operations and Venn Diagrams for Complement of a Set, Disjoint Sets, Subsets, Intersection and Union of Sets. Scroll down the page for more examples and solutions.

The set of all elements being considered is called the Universal Set (U) and is represented by a rectangle.

- The complement of A, A’, is the set of elements in U but not in A. A’ ={x | x ∈ U and x ∉ A}
- Sets A and B are disjoint sets if they do not share any common elements.
- B is a proper subset of A. This means B is a subset of A, but B ≠ A.
- The intersection of A and B is the set of elements in both set A and set B. A ∩ B = {x | x ∈ A and x ∈ B}
- The union of A and B is the set of elements in set A or set B. A ∪ B = {x | x ∈ A or x ∈ B}
- A ∩ ∅ = ∅
- A ∪ ∅ = A
Set Operations And Venn Diagrams
Example:
1. Create a Venn Diagram to show the relationship among the sets.
U is the set of whole numbers from 1 to 15.
A is the set of multiples of 3.
B is the set of primes.
C is the set of odd numbers.
2. Given the following Venn Diagram determine each of the following set.
a) A ∩ B
b) A ∪ B
c) (A ∪ B)’
d) A’ ∩ B
e) A ∪ B’

READ: 25 Basic Sets and Venn Diagram Tips and Formulae for BECE and WASSCE Exams
Venn Diagram Examples
Example:
Given the set P is the set of even numbers between 15 and 25. Draw and label a Venn diagram to represent the set P and indicate all the elements of set P in the Venn diagram.
Solution:
List out the elements of P.
P = {16, 18, 20, 22, 24} ← ‘between’ does not include 15 and 25
Draw a circle or oval. Label it P. Put the elements in P.
Example:
Draw and label a Venn diagram to represent the set
R = {Monday, Tuesday, Wednesday}.
Solution:
Draw a circle or oval. Label it R . Put the elements in R.
Example:
Given the set Q = { x : 2x – 3 < 11, x is a positive integer }. Draw and label a Venn diagram to represent the set Q.
Solution:
Since an equation is given, we need to first solve for x.
2x – 3 < 11 ⇒ 2x < 14 ⇒ x < 7
So, Q = {1, 2, 3, 4, 5, 6}
Draw a circle or oval. Label it Q.
Put the elements in Q.
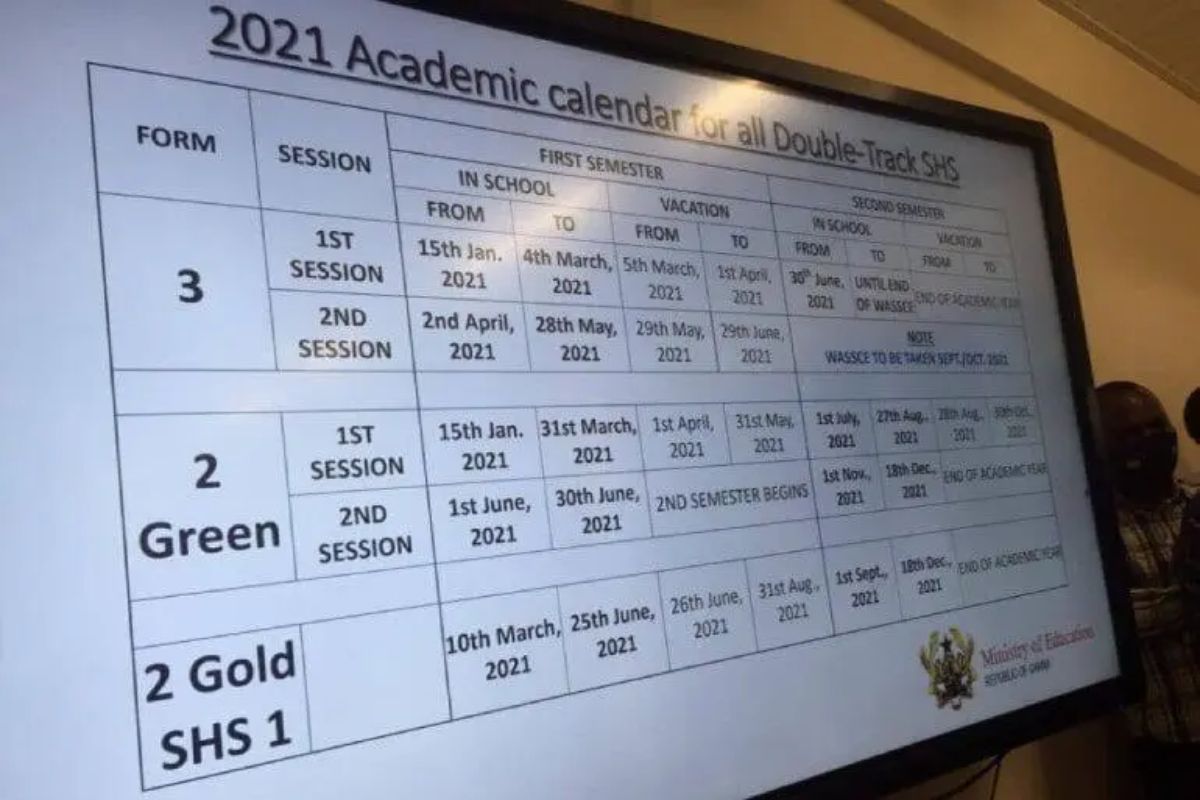 GES 2024-2025 Academic Calendar for Public Schools
  GES to recruit university graduates and diploma holders-GES Director General
  GES is expected to announce reopening dates for public schools today
  Dr. Bawumia’s Smart Phone Credit Will Take 125 Years To Repay: A Misleading Promise
 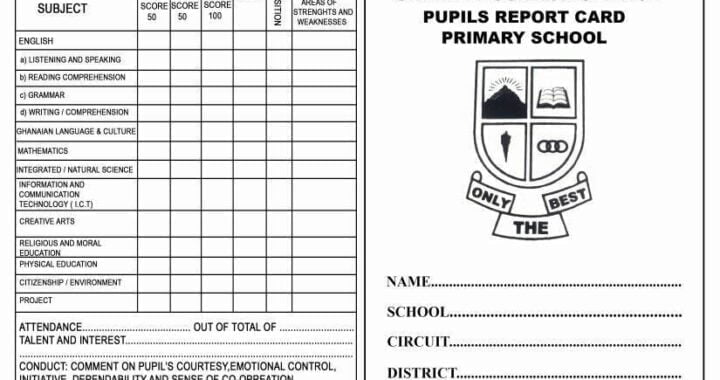 2024-2025 Report Card Grading, Student Attitudes, Interests and Conduct Samples for Teachers
  US Staffing Agencies Recruiting International Job Seekers With Work Visa Sponsorship
  Buy 1 Gig MTN or Airtel Tigo data for only GHS6.00 not GHS17.00